The carbon payback period (CPP) of a photovoltaic solar panel installation
In what context is installing solar panels carbon-effective?
Increasingly adopted by both individual homes and collective housing, photovoltaic solar panels are emerging as an accessible solution to the urgent need to decarbonize electricity production.
Three major factors can be identified in the growing use of solar panels—aside from the growing environmental awareness of societies and individuals:
A strengthening regulatory framework that sets clear milestones. France’s National Low-Carbon Strategy (SNBC) sets targets of a 49% reduction in greenhouse gas (GHG) emissions by 2030 compared to 2015, and carbon neutrality by 2050 for the building sector. Achieving these goals notably involves addressing the energy used in our buildings.
The energy performance of photovoltaic panels: installations generate electricity without emitting CO₂ during their operational phase. Moreover, the panels have a very favorable energy return on investment. In Europe, it is estimated that it takes, on average, 1 to 1.5 years for an installation to produce as much electricity as was used to manufacture it.
Financial incentives and subsidies, which vary depending on the size of the installation and the country. These are clear accelerators of the energy transition, though they can also lead to unintended consequences such as the oversizing of systems to maximize the financial aid received.
These three aspects have long been the main decision-making criteria, while the initial carbon footprint of the panel itself is now central to project assessment. That is the lens we will adopt in this article. In a context where carbon approaches, tools, and indicators are multiplying across the entire production chain, how can we determine whether a building-integrated photovoltaic installation is truly relevant from a carbon standpoint?
After a brief overview of how photovoltaic panels work, we will analyze the carbon impact of a panel across all phases of its lifecycle, before comparing the Carbon Payback Period (CPP) of various installations with different production variables.
Photovoltaic Panel Overview
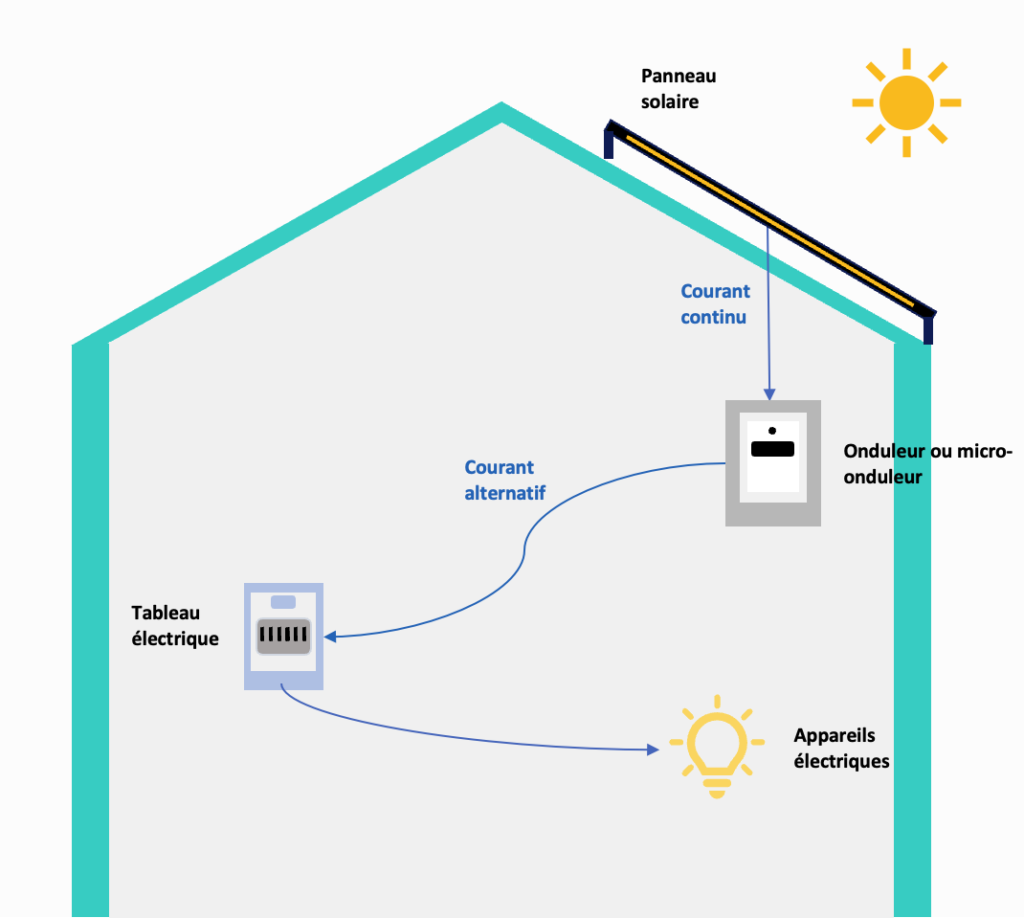
Photovoltaic (PV) solar panels convert solar energy into direct current (DC) electricity. They serve as an energy vector that enables self-consumption, potentially covering up to 70% of a detached home’s electricity needs.
There are several types of solar panels with varying levels of efficiency and cost. The two most common technologies are monocrystalline and polycrystalline (depending on the number of silicon crystals). The former is more expensive but offers higher efficiency.
What is the carbon footprint of a photovoltaic panel?
The carbon cost of a photovoltaic panel refers to the greenhouse gas (GHG) emissions generated throughout its entire lifecycle, which includes:
Production: the extraction and processing of raw materials
Construction: transportation to the site and installation
Operation: use and maintenance over time
End of life: dismantling and disposal or recycling
The distribution of emissions across these phases can be observed in the following breakdown:
Focus on the Production Phase: Material Extraction and Manufacturing
The production phase is by far the largest contributor to GHG emissions. This is mainly due to the panel’s composition: although glass makes up the largest portion of the panel by weight, silicon is the biggest factor in increasing its carbon footprint.
This can be explained by:
The highly energy-intensive extraction and processing methods
The fact that these steps are primarily located in China, which relies on a particularly carbon-intensive energy mix
Additionally, the manufacturing of the final panels is also often based in China, subjecting the process to an energy mix that further increases the panels’ carbon footprint
Ultimately, the carbon impact of production largely depends on the location (and associated energy mix) of the production chain: “For a Chinese electricity mix, the carbon footprint of photovoltaics averages 43.9 gCO2eq/kWh, compared to 32.3 gCO2eq/kWh for the European mix and 25.2 gCO2eq/kWh for the French electricity mix.” (Ademe, 2021)
This means that relocating a phase of the production chain such as panel assembly in France can effectively reduce their carbon footprint!
On average, 94% of photovoltaic panel components can be recycled. Looking at the composition of a solar panel:
Glass is reused within the production chain itself and, along with aluminum, is repurposed for packaging.
Copper is used in the manufacturing of electronic circuits.
Silicon can be recycled up to four times to create new photovoltaic cells.
Plastic, however, remains the most difficult element to recycle.
Since 2012, Waste Electrical and Electronic Equipment (WEEE) regulations have required manufacturers to organize collection systems for recycling. While these steps are not included in the LCA (Life Cycle Assessment) presented above—as it relies on default results—manufacturers can still highlight these benefits through a Module D (benefits and loads beyond the system boundary).
Case Study: Comparison of the Carbon Payback Time (CPT) of Photovoltaic Installations
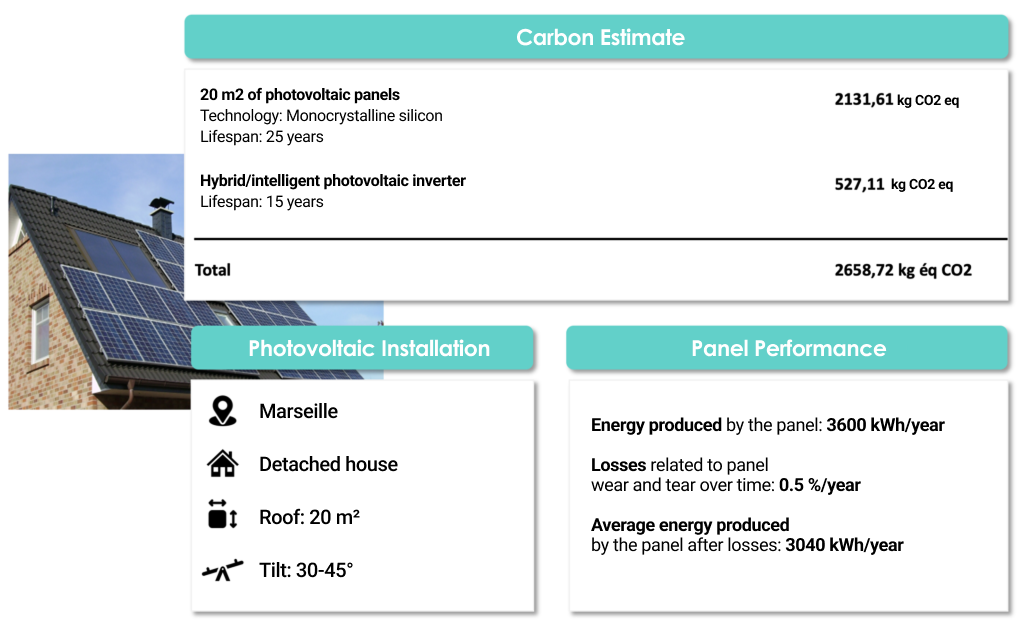
In all the projects studied, we consider a 100 m² single-family home with a 20 m² rooftop panel installation, tilted between 30° and 45°.
Furthermore, all Life Cycle Assessment (LCA) calculations are performed using the dynamic method developed under the 2020 Environmental Regulation (RE2020), which takes into account the timing of greenhouse gas (GHG) emissions.
Focus on a 25-Year Photovoltaic Project in Marseille with a Standard Panel
For this first case, we consider a panel with the characteristics of a Default Environmental Data (DED) sheet published by the INIES database. These are generic datasheets for equipment or materials providing high-end carbon impact estimates by product type.
We also assume that the panel will replace electricity from the national grid (0.069 kg CO₂ eq/kWh, according to INIES). Thus, we compare our installation over time with the carbon evolution of electricity consumption from the grid for our needs:
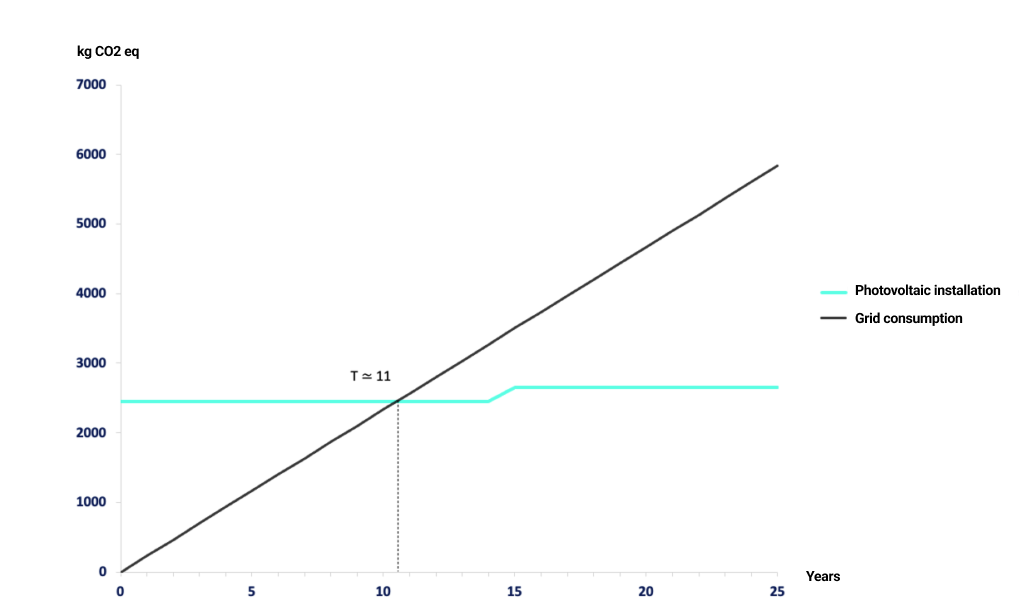
Comparison of the carbon impact of solar panel consumption versus grid electricity consumption (over 25 years)
Note: The slight jump in the photovoltaic installation curve corresponds to the replacement of the inverter after 15 years.
At T=0, we observe the high initial carbon cost of the photovoltaic installation—this corresponds to the panel’s production phase—while the black curve (grid electricity) starts at zero.
At T=11 years, the carbon impact of electricity consumption from the grid equals the initial carbon cost of our installation: this marks the Carbon Payback Time (CPP) of our panels.
At T=25 years, the grid emits 2.2 times more GHGs than our installation.
Moreover, with proper maintenance or by choosing a panel with greater durability, the installation can remain viable up to 40 years. Over this timeframe, and assuming the same panel performance, the carbon impact of grid electricity will be three times higher than that of the installation—even when accounting for inverter replacement and panel efficiency loss.
Other Case Studies – More Efficient Panels and Different Sunlight Conditions?
In this study, we considered the impact based on an LCA of a Default Environmental Data (DED) sheet. If the panel is assembled in France, part of the highly carbon-intensive production can be avoided. Moreover, when a manufacturer focuses on the environmental impact of its products, it can justify a lower impact by publishing a Product Environmental Profile (PEP) sheet.
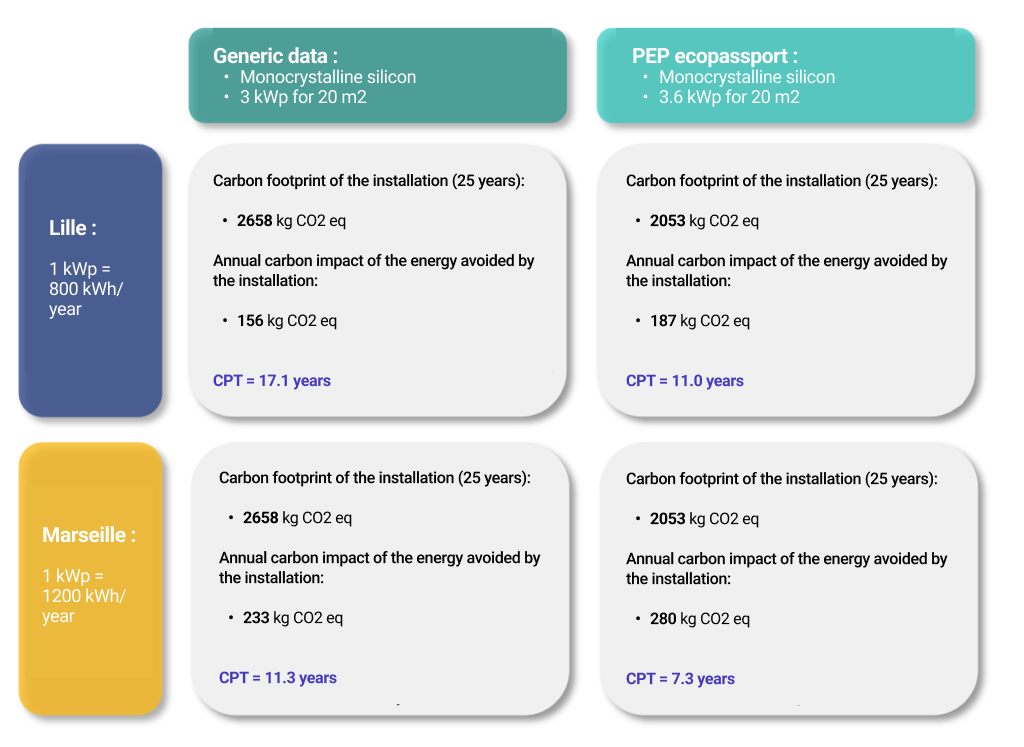
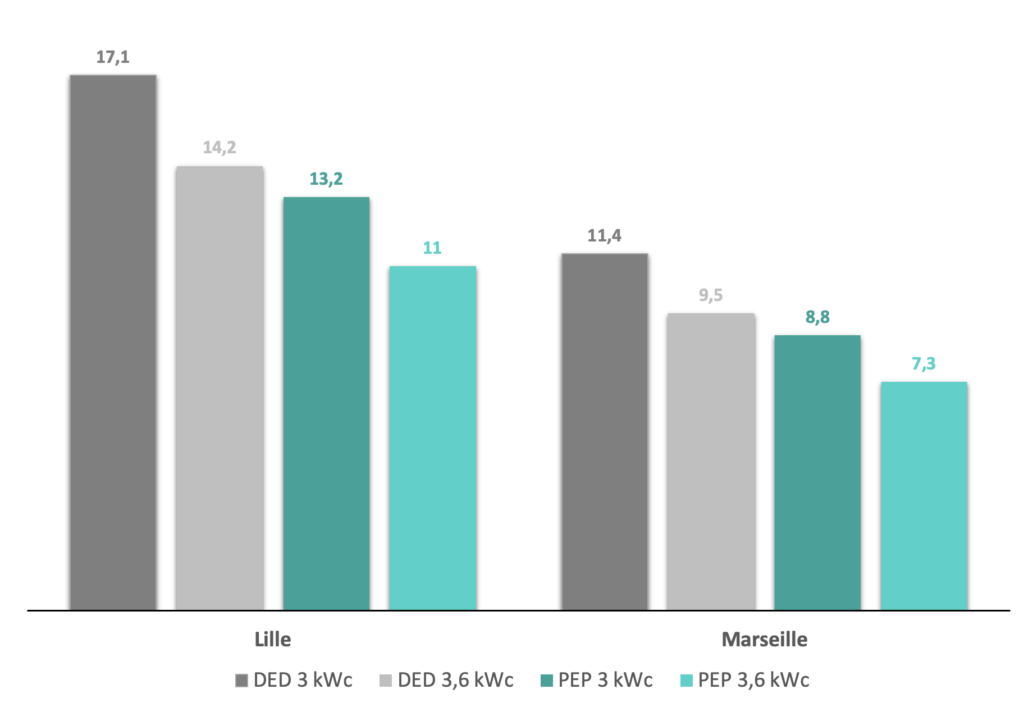
Let’s examine the Carbon Payback Times (CPT) when varying the panel type (DED or PEP) and location (Marseille or Lille):
Comparison of the Carbon Payback Period (CPP) of two installations (DED and PEP) based on their geographic location
Note: The energy production of the photovoltaic installation varies depending on the cases studied. We compare equivalent systems, so the grid consumption increases in line with the installation’s energy production, which explains the variable annual carbon impact of the grid.
We observe that the PEP panel has a better Carbon Payback Period (CPP) than the DED panel, regardless of its location.
Inies database data used in the calculations:
Photovoltaic solar panel PEP: 27231
3kW standalone inverter DED (Inies ID: 31961)
Varying the Power Output
To explore further and with the aim of comparing parameters one by one, we will vary the power output for each type of panel. The following results are obtained:
Comparative Summary of the Carbon Payback Time (CPT) of Various Photovoltaic Projects
Conclusion
The three key takeaways from the different case studies are as follows:
The importance of geographic location At equal power outputs, the Carbon Payback Time (CPT) of an average panel (DED) is shorter in locations with higher solar irradiance.
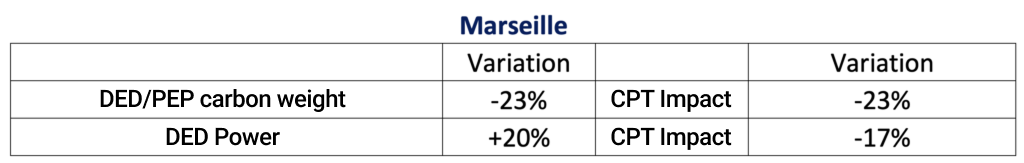
Initial carbon footprint (production) matters more than panel power Given equal sunlight conditions, it is better to prioritize a low-carbon panel rather than a highly efficient one. For example, in Marseille, we examined the variation of CPT based on changes in power output and initial carbon footprint of the panel:
There is a correlation coefficient of 1 between carbon footprint and CPT, compared to 0.85 for power—meaning the panel’s initial carbon impact influences the CPT more than its power rating.
Combining low manufacturing carbon footprint and energy efficiency greatly reduces CPP In both Lille and Marseille, switching from a 3 kWc DED panel to a 3.6 kWc PEP panel results in a reduction of the CPT by 35% and 36%, respectively.
Finally, it is important to put the different renewable energy solutions into perspective and to encourage well-informed, environment-adapted choices rather than default energy decisions.
Glossary
Energy Return Rate: the ratio between the energy delivered by a system over its lifecycle and the energy required to build and install it.
Embodied Energy: the total amount of energy used for the manufacture, installation, maintenance, and end-of-life management of equipment.
Life Cycle Assessment (LCA): a method for calculating carbon impact based on accounting for the physical flows of a system throughout all its life phases (production, construction, operation, end of life) and associating them with environmental impacts.
Default Environmental Data (DED): generic building data established by the ministry responsible for construction when specific data is unavailable.
Product Environmental Profile (PEP): a datasheet containing specific information about an electrical, electronic, or HVAC equipment, certified by several organizations according to specific rules (notably for LCA calculations).